v0.1.1Latest release

One Flow.
Every test profile.

Author API journeys once in YAML or Python. Run them from integration to stress and soak, then see exactly where the time, and the failure, went.

10,000
sustained concurrent VUs
~70%
generator CPU headroom
68.8 KiB
heap per VU at 10k
1 flow
shared by YAML and Python

Measured on a 10-core Apple-silicon laptop against a 100 ms latency-bound stub. Read the method

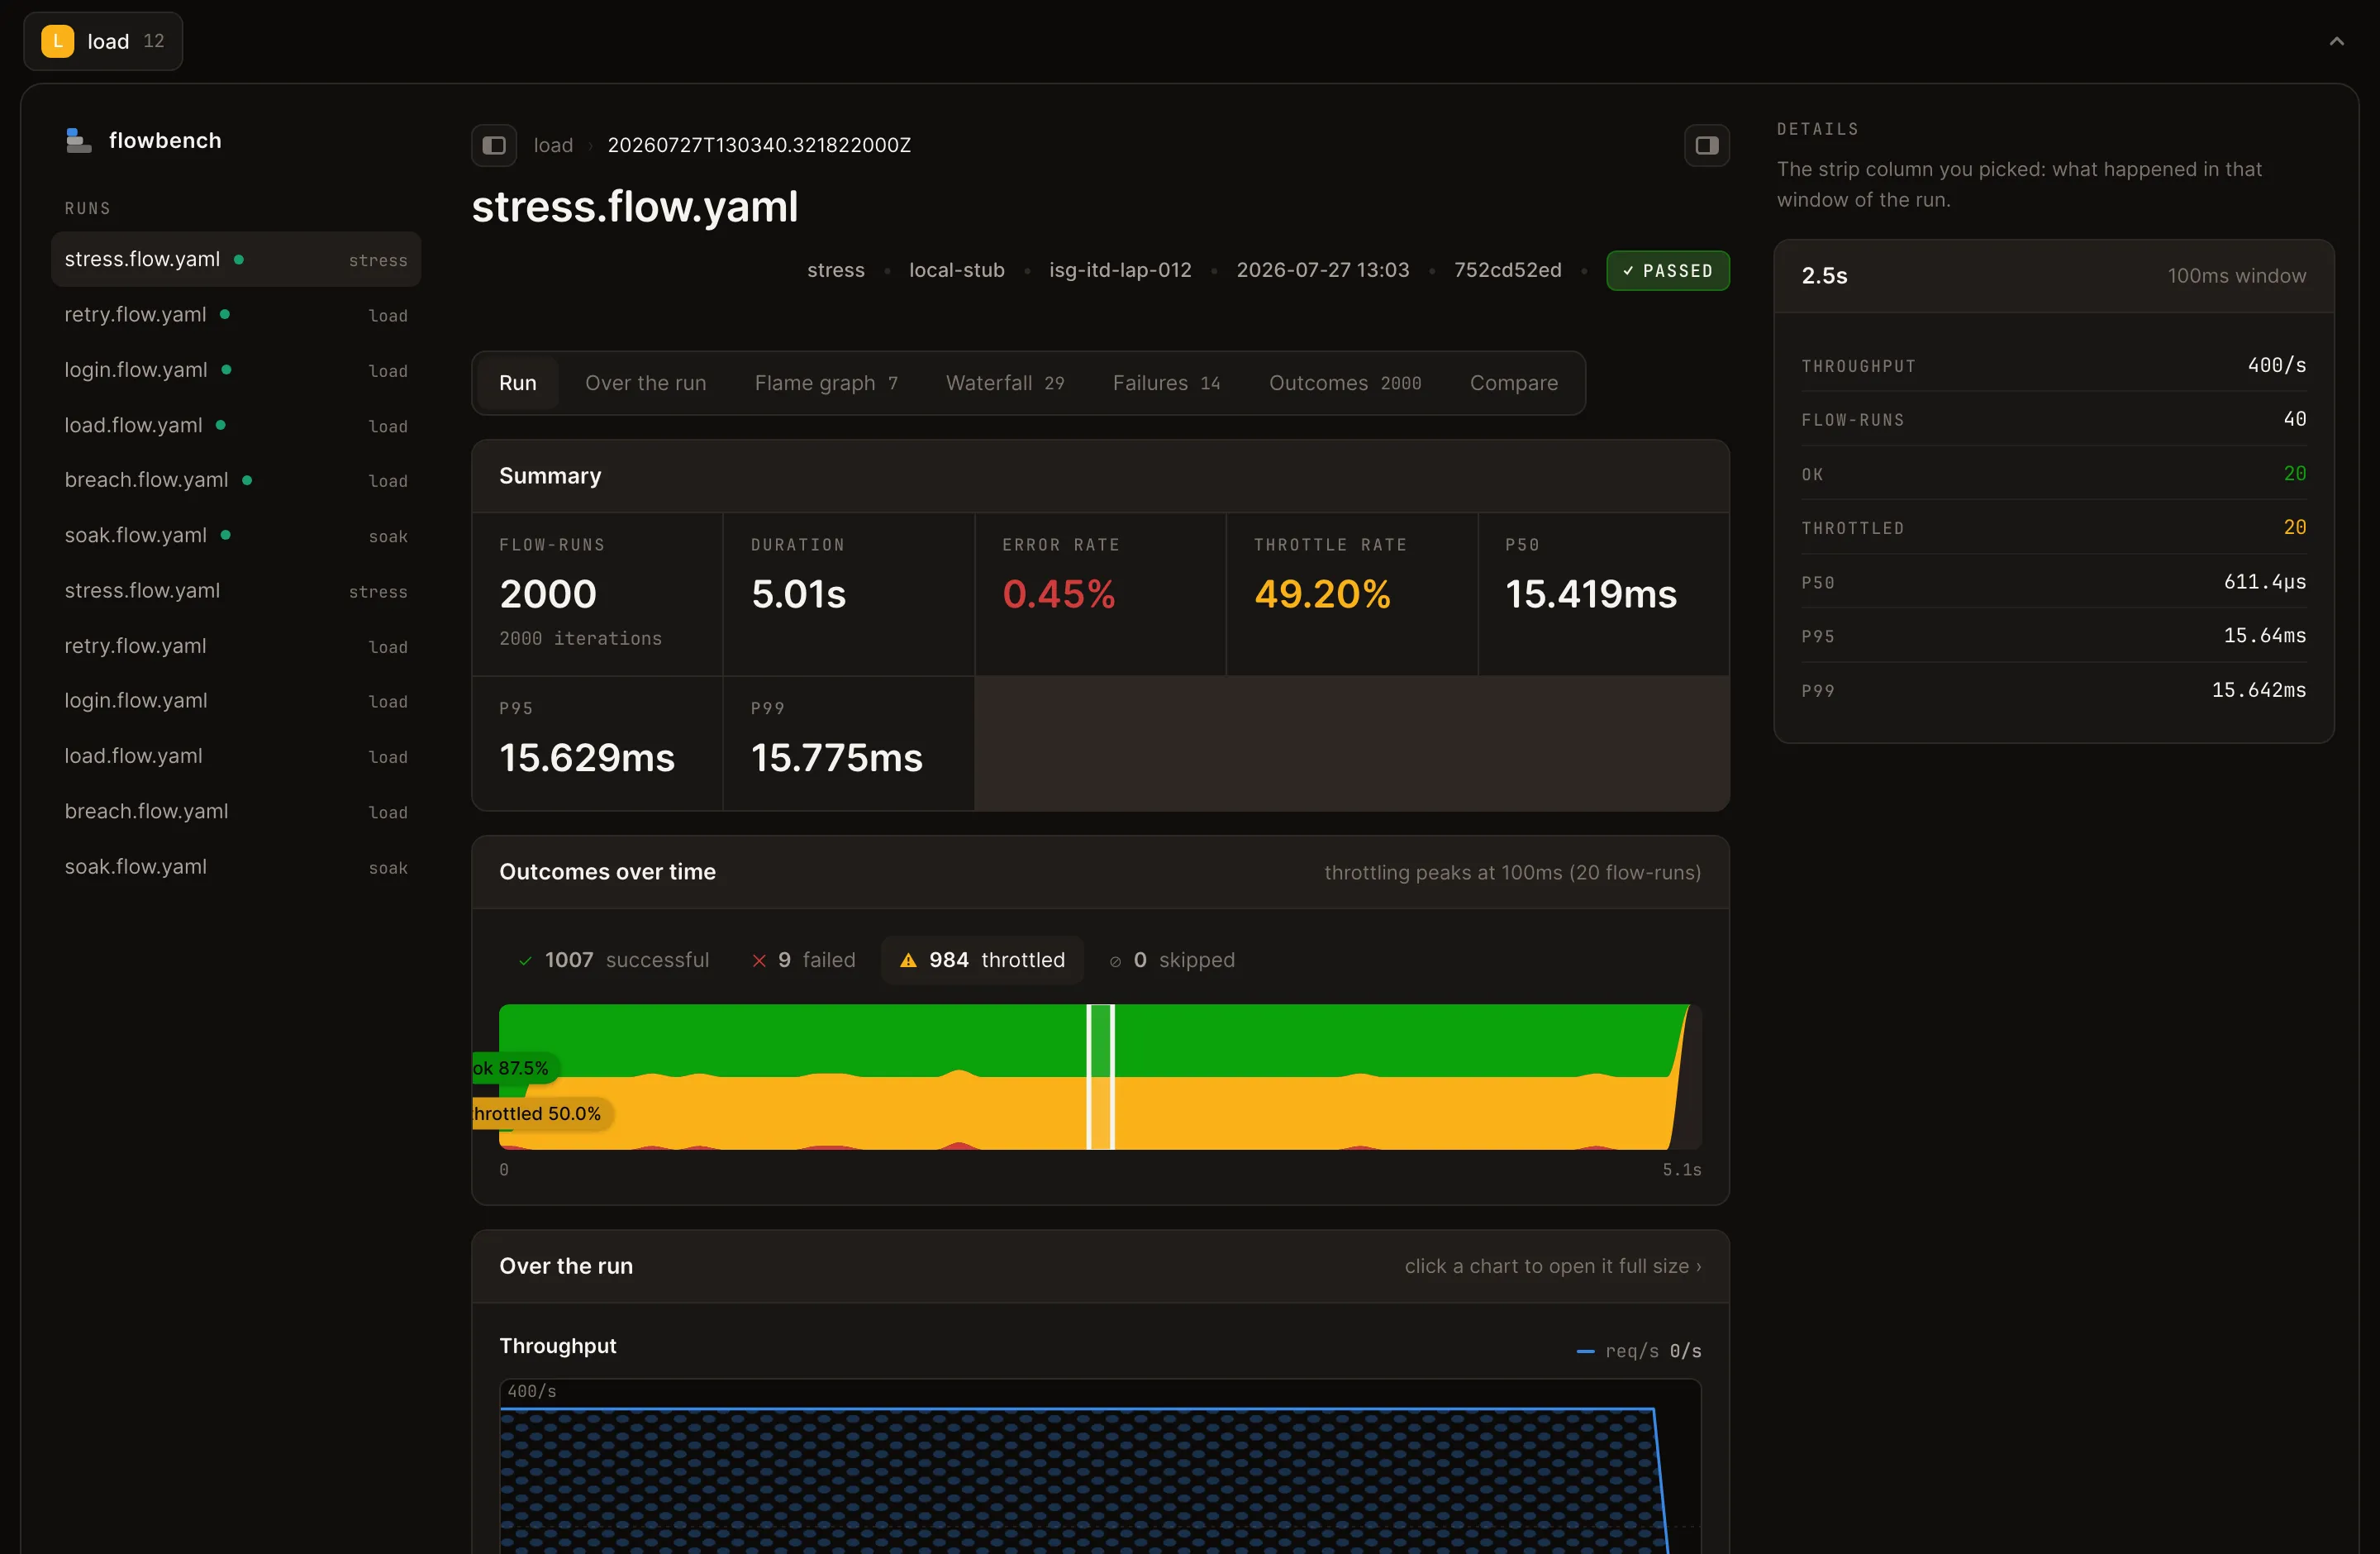
The Flowbench run overview: flow-runs, duration, error rate, throttle rate and percentile tiles above the outcome strip.
Dashboard
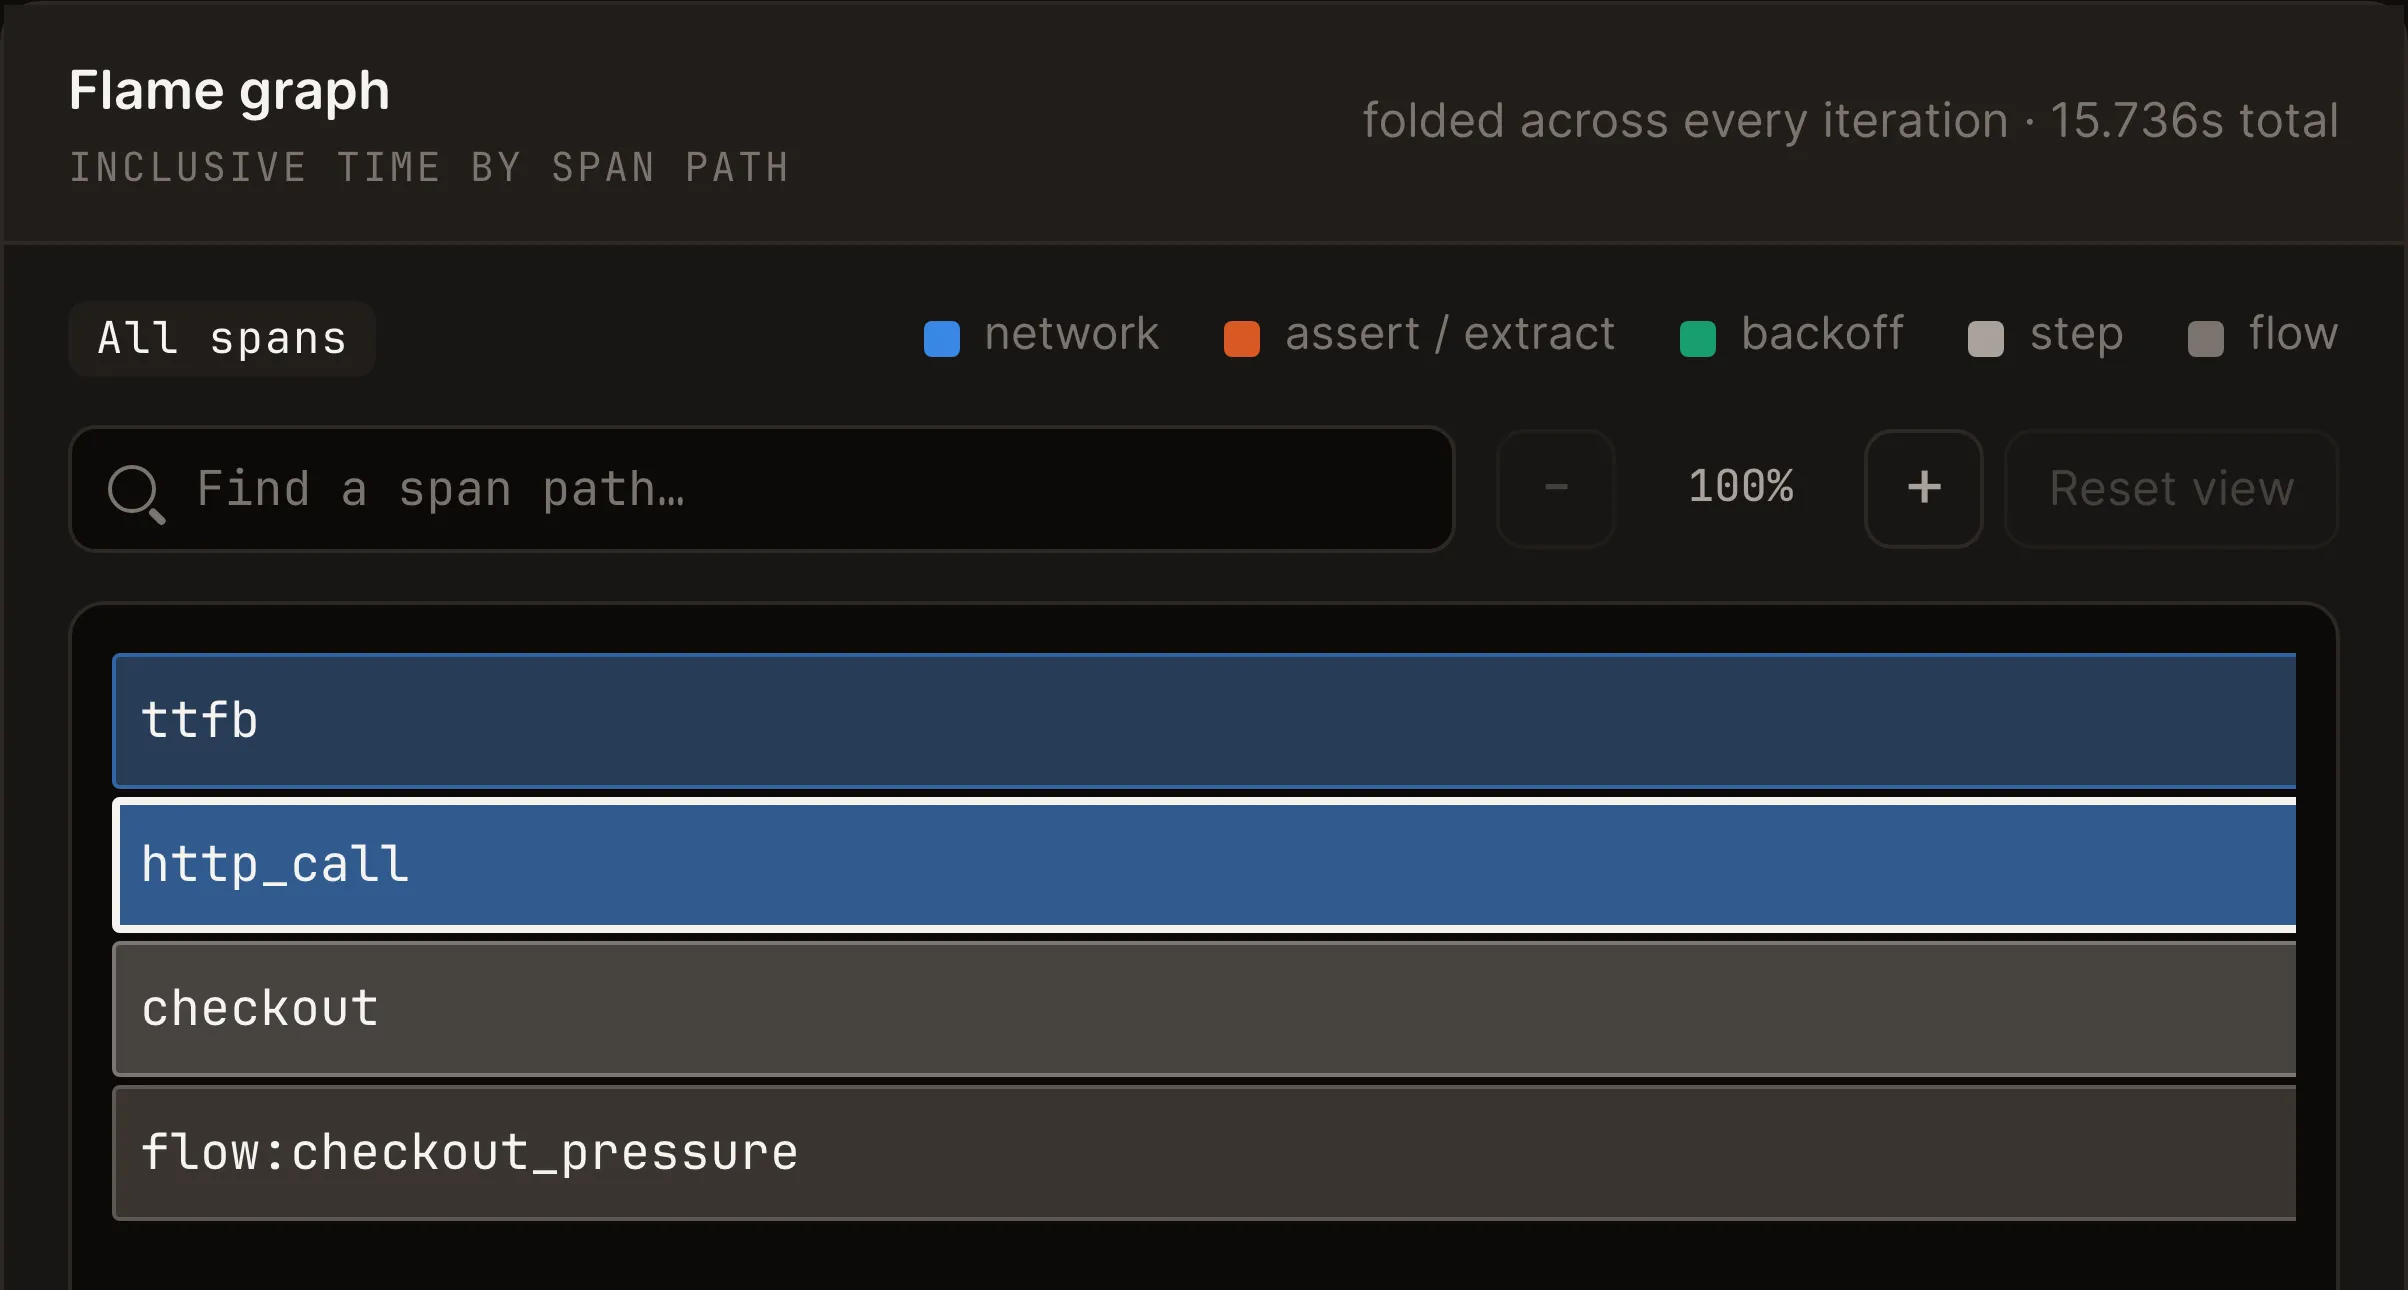
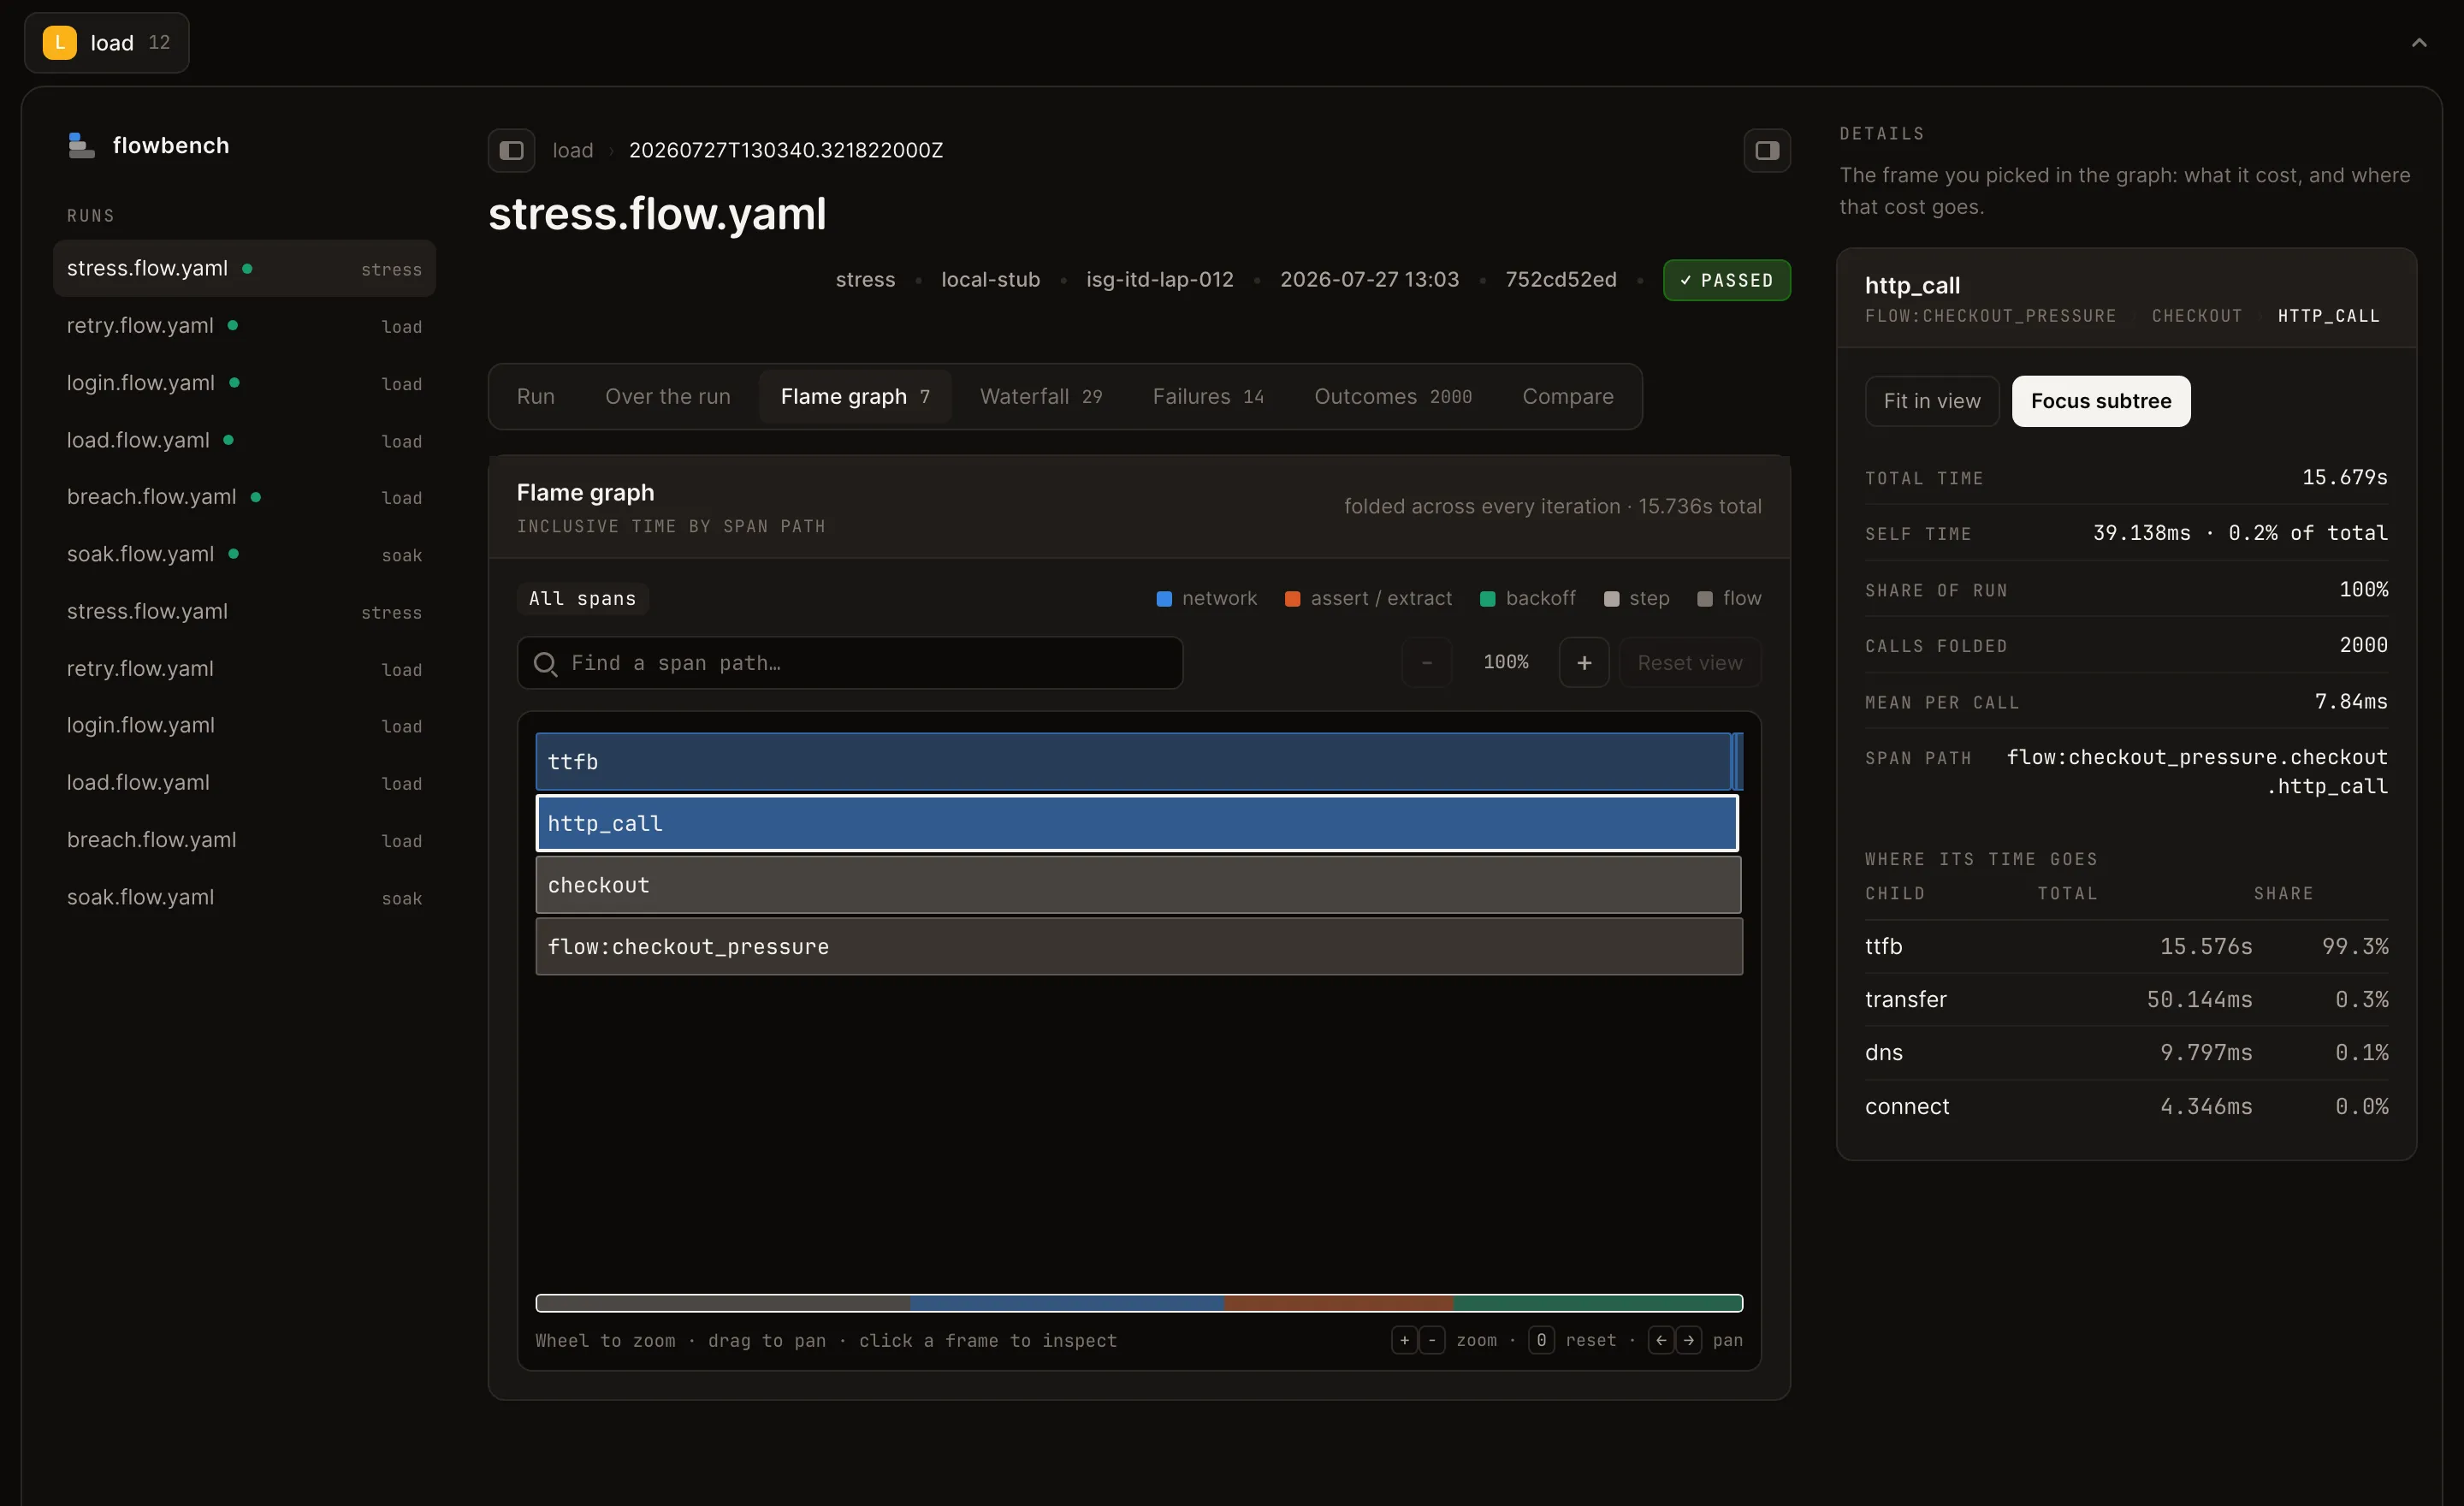
The Flowbench flame graph with spans folded across every iteration and one frame selected.
Flame graph
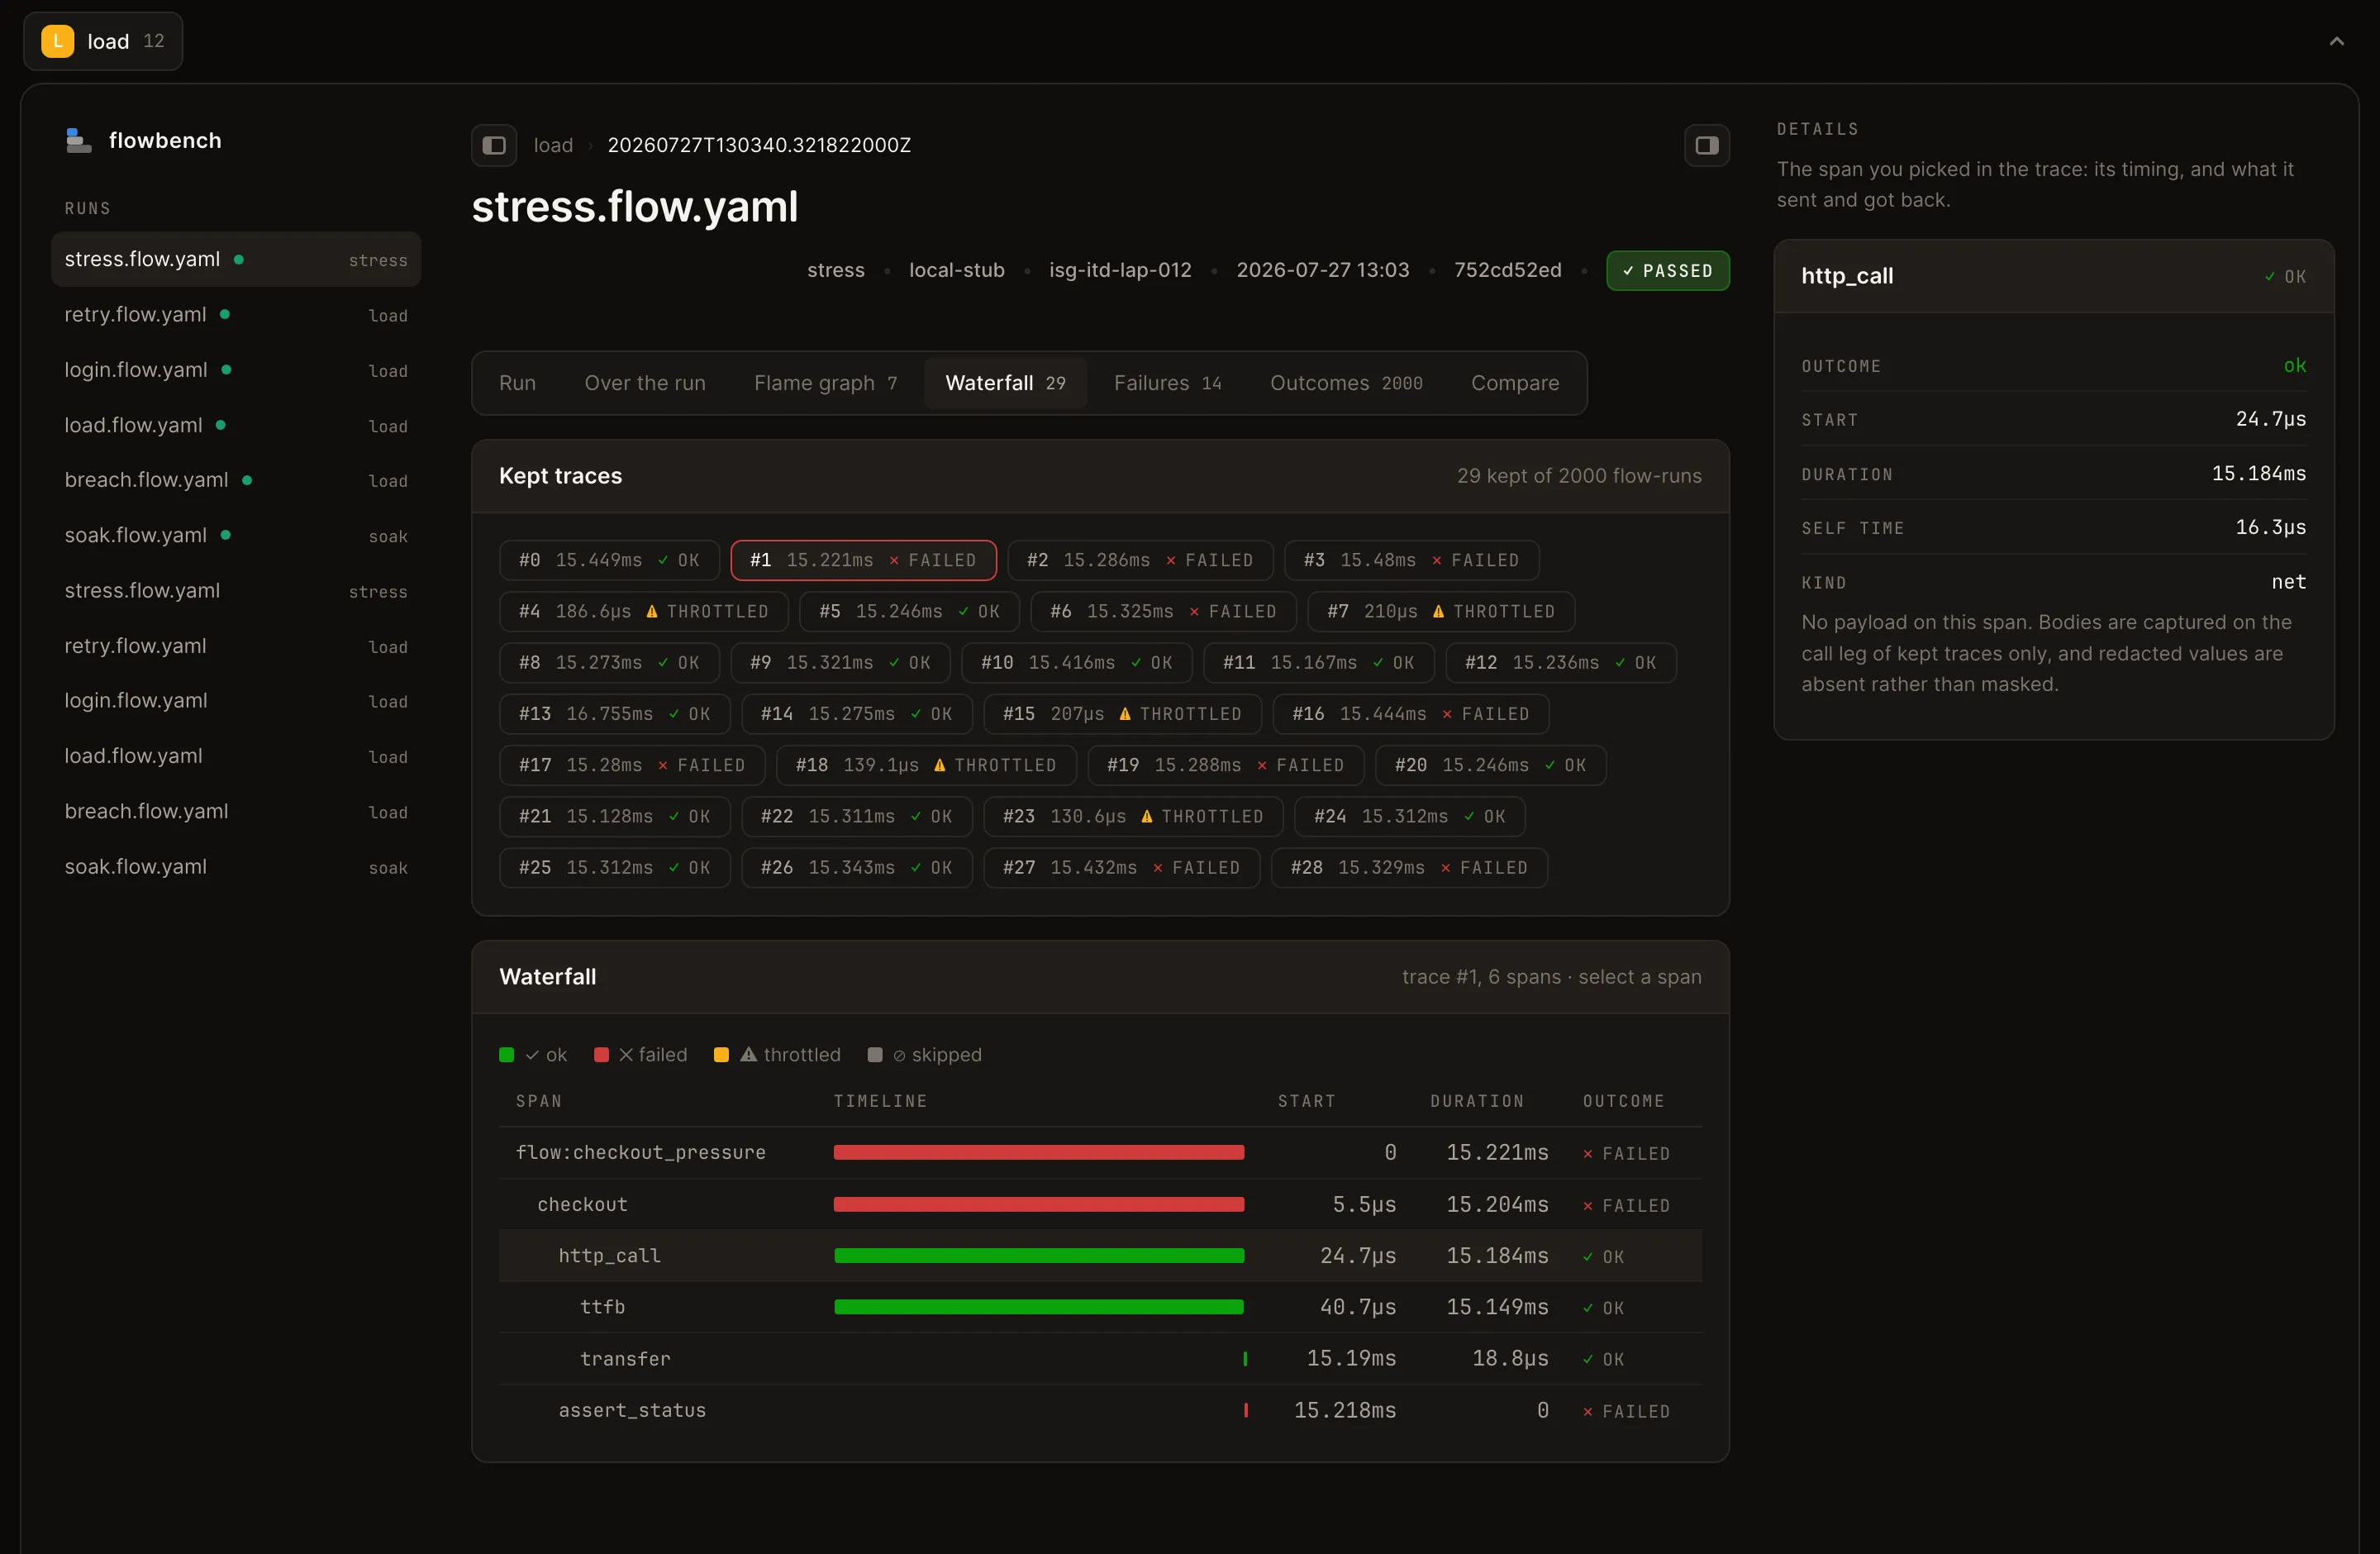
The Flowbench waterfall for a single captured trace, span by span with start, duration and outcome.
Waterfall
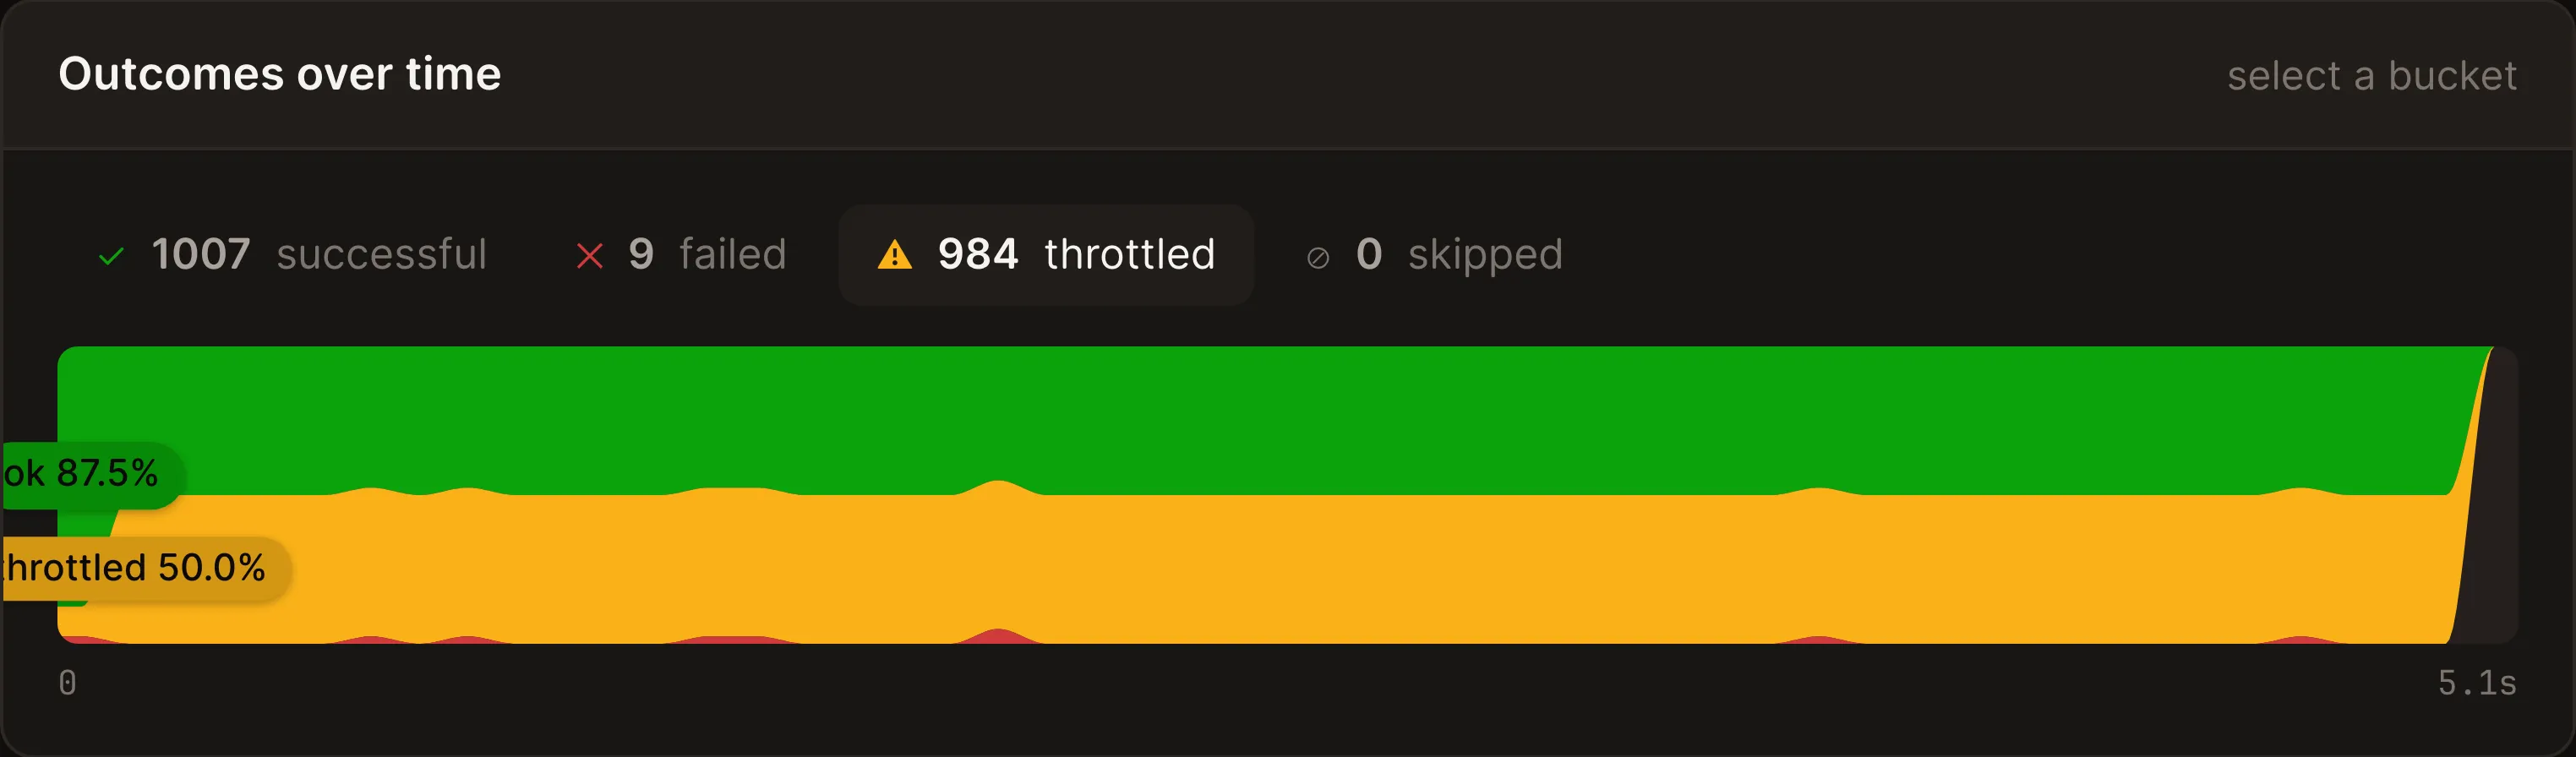
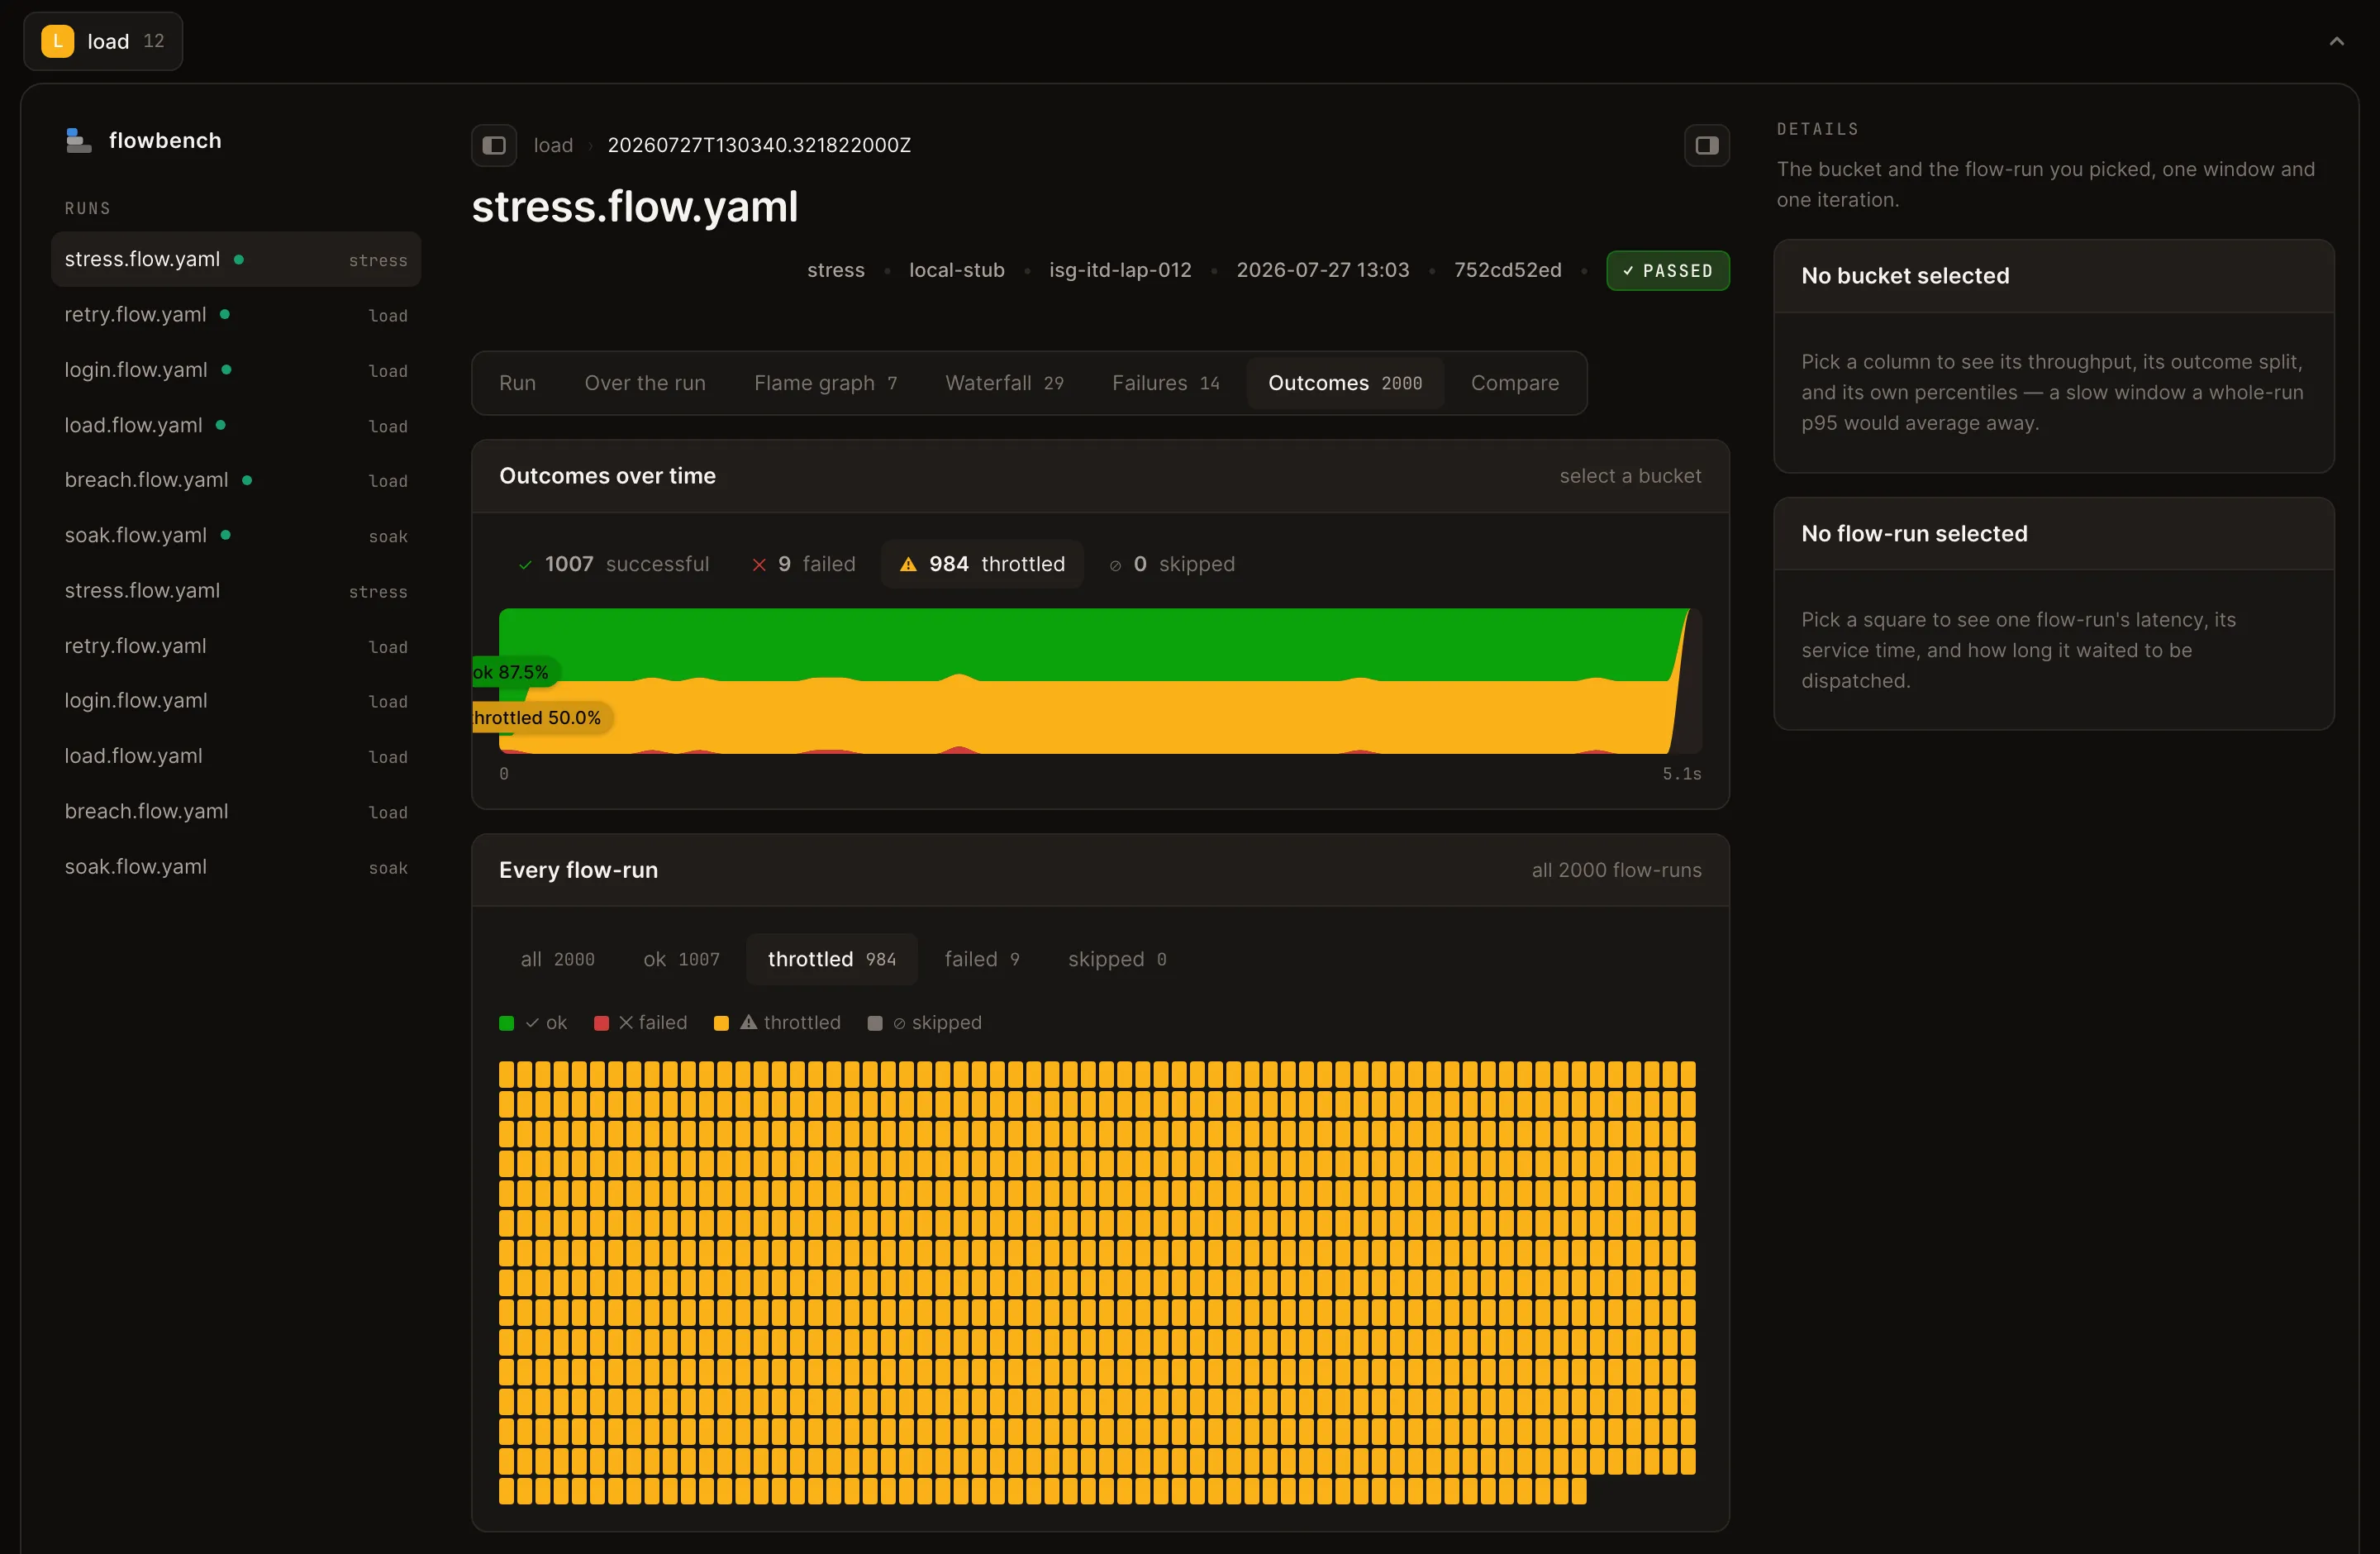
Every flow-run in the run as a grid, filtered to the 984 throttled ones.
Outcomes
  • One canonical flow.

    Author in YAML or Python. Both resolve to the same model, so neither is a second-class port of the other.

  • One measured engine.

    Go, a goroutine per VU, explicit safety ceilings — and a published footprint rather than a claim.

  • One span vocabulary.

    Dashboard, flame graph and waterfall agree because they are three readings of the same spans.

Capabilities

Everything you need to know what actually happened.

One engine, one result model, one set of views — so the answer never depends on which tool you happened to reach for.

One authored flow

Change the profile, not the journey.

The steps are the contract — what the journey does, what it extracts, what it asserts. The profile is how hard you push. So the same file is your CI check and your stress run, and when stress finds something you are debugging a journey you already trust.

Profiles and thresholds
stress.flow.yaml
flow: checkout_pressure
steps:
  - id: checkout
    call: POST /checkout
    assert:
      - status == 200
profile:
  mode: integration
profile:
  mode: load
  arrival_cap: 150/s
  thresholds:
    - p95(latency) < 100ms
profile:
  mode: stress
  arrival_cap: 400/s
  thresholds:
    - error_rate < 2%
profile:
  mode: soak
  vus: 10
  hold: 12s

Honest outcomes

A rate limiter is not a bug.

throttled is its own outcome class, never folded into failed. A working limiter reads as a working limiter — not a 40% failure rate you go hunting for.

The results server's outcomes card: 1007 successful, 9 failed and 984 throttled flow-runs above a strip where throttling holds its own amber band.

One span vocabulary

The widest frame is the answer.

Every view folds the same spans, so the flame graph, the waterfall and the outcome grid cannot tell different stories. Here, the target's wait — not your network — is 99.3% of the cost.

The results server's flame graph, spans folded across every iteration: ttfb and http_call as full-width frames above checkout and the flow.

Local-first

One binary. Your runs stay yours.

A run is a plain directory of JSON — no hosted control plane, no account, nothing to exfiltrate your latencies. A threshold breach exits non-zero, so CI fails on the finding.

420K on disk
  • runs/20260730T193042Z/
  • meta.json
  • metrics.json
  • series.json
  • folded.json
  • traces.json

Target telemetry

Whose CPU ran out?

Attach the lightweight agent and a breaching stress run classifies its own knee — an enforced limit and genuine saturation stop looking identical.

knee
throttled

throttle rate rose 2.1% → 49.2% across the knee while target CPU stayed flat — the target enforced a rate limit rather than saturating

How it works

From an empty file to evidence in ten minutes.

No agent to deploy, no dashboard to provision, no account. A binary, a flow file, and a target you are allowed to point it at.

  1. stress.flow.yaml
    flow: checkout_pressure
    steps:
      - id: checkout
        call: POST /checkout
        assert:
          - status == 200
    profile:
      mode: stress
      arrival_cap: 400/s
      hold: 5s

    01Author the flow. A name, ordered steps, and the profile — one YAML document.

  2. flowbench — zsh
    $ flowbench run stress.flow.yaml \
        --target target.yaml
    
    2000 flow-run(s) in 5.01s
    error_rate=0.10%
    throttle_rate=40.55%
    p95(latency) < 300ms: ok
    
    $ echo $?
    0

    02Run it against a gated target. The allow-list and ceilings are checked before any load is generated; a breach exits non-zero.

  3. 127.0.0.1:7580
    The Flowbench results server showing the stress run's summary: 2000 flow-runs, 0.45% error rate, 49.20% throttle rate, thresholds passed.

    03Read what happened.flowbench serve opens every run — the same spans behind every view.

Comparison

One tool, or three you keep in sync.

Nothing here is a claim about a named product — it is the cost of the stack most teams assemble instead: a functional suite, a load tool, and somewhere to look at the result.

Flowbench compared with a hand-assembled testing stack
CapabilityFlowbenchA stitched stack
One journey across every profileThe same file, integration through soakDuplicated per tool, then drifts
Throttling as its own outcomethrottled never folds into failed429s land in the error bucket
Functional and load share a result modelOne collector, one set of viewsTwo result formats to reconcile
Aggregate cost and one traceFlame graph and waterfall, same spansInstrumentation glue, if at all
Target resources aligned to the runAgent samples into the run itselfTwo timelines, eyeballed side by side
Runs as plain local artifactsA directory of JSON you ownWhatever each tool decided
Install

One binary. No account, no tier, no seat.

Everything below is in the box. There is no paid edition holding a feature back — the only thing a release gates is which platform archive you download.

  • Engine + CLI
  • YAML flow DSL
  • Python SDK
  • Results server
  • Target agent
  • Prompt diffs

Archives and checksums.txt are attached to everyrelease. The agent is Linux-only in v1; it fails open elsewhere.

tar -xzf flowbench_<version>_<os>_<arch>.tar.gz
sudo mv flowbench /usr/local/bin/

flowbench version

Every release ships archives per platform plus checksums.txt.

git clone https://github.com/blackprince001/flowbench
cd flowbench

go build -o flowbench ./cmd/flowbench

Pure Go, no CGO — cross-compiles with GOOS/GOARCH.

pip install flowbench
# or
uv add flowbench

Python 3.10+, depends only on httpx.

FAQ

The questions that decide it.

Short answers here, the long ones in the documentation.

Is Flowbench a hosted service?

No. v1 is packages and binaries: no accounts, no hosted control plane, no deployment dependency. You install it, point it at a target you are allowed to load, and read the results locally. Teams and hosting are explicitly deferred.

Which protocols are supported?

HTTP, gRPC, GraphQL and WebSocket, each with its own adapter. Phase spans — DNS, connect, TLS, TTFB, transfer — are recorded per call, so the flame graph attributes time to the phase rather than the whole request.

How is this different from running a functional suite and a load tool separately?

Those two answer different questions in different vocabularies, and you reconcile them by hand. Flowbench executes one authored flow under both, through one collector — so the assertion that failed and the p95 that moved are facts about the same run, in the same result model.

Can the same flow run from Python?

Yes. The Python SDK expresses the same model as the YAML DSL. Run the file through the CLI and the Go engine executes it at whatever scale the profile asks for; run it with Python directly and the process executes it for integration and system work.

Where are results stored?

In a plain directory per run under runs/ — meta, metrics, series, folded spans and traces, as JSON. Around 420 KB for a 2,000 flow-run stress run. No database, nothing to migrate, and diffable in git if you want it there.

How does it keep a load test off the wrong host?

The target file is a host allow-list: a flow can only reach hosts under base_urls. It also carries max_vus and max_rps ceilings and an optional disallowed_modes list, and a run that would exceed any of them is refused before a single request is generated.

Does a throttled response fail the run?

It depends on the question the profile is asking. Integration and system count throttles as failures — you asked whether it works. Load, stress and soak count them as data, because a rate limiter doing its job is a finding, not a fault. as_error overrides the default per step.

Can I use it in CI?

Yes, and that is the point of thresholds. A load-family run exits 0 when they held, 1 on a breach, abort or interrupt, and 2 on a pre-run error like a parse failure or a safety-gate refusal. The verdict is persisted with the run, so nobody re-derives it later.

Stop rewriting the same journey.

Author it once. Change the profile. Keep the evidence.